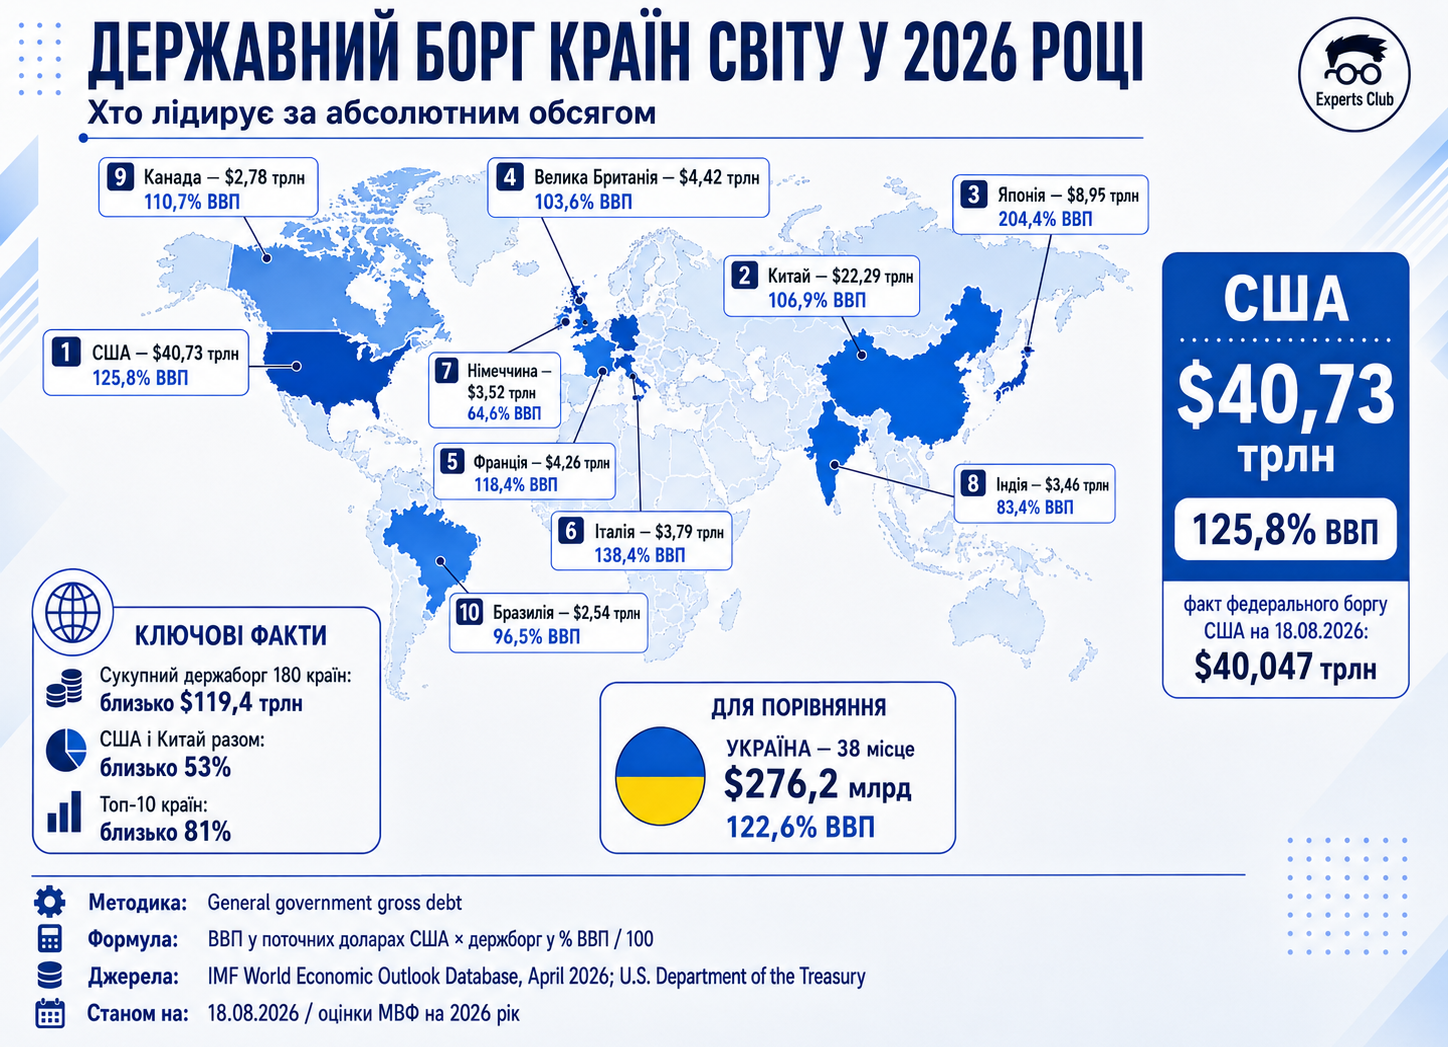
The US national debt exceeded $40 trillion for the first time, cementing the United States as the world's largest public debtor in absolute terms.
According to the US Treasury Department, on August 18, 2026, the total federal debt reached $40.047 trillion. Only five months earlier, it crossed the $39 trillion mark. At the same time, about $32.27 trillion belongs to the debt held by investors, the Federal Reserve System and other holders, and about $7.78 trillion is to domestic obligations.
For a correct comparison of all countries, the Experts Club did not use national definitions of debt, which differ significantly, but the single basis of the World Economic Outlook of the International Monetary Fund for April 2026 year.
Rating methodology
The basis is the General government gross debt indicator — the gross debt of the public administration sector.
The absolute amount is calculated according to the formula:
GDP of the country in current US dollars × public debt in % of GDP / 100.
Thus, the rating takes into account not only the debt of the central government, but the entire public administration sector in accordance with IMF methodology.
This is fundamentally important for comparing the USA, China, Japan, EU countries and developing countries.
For the USA, the comparative estimate of the IMF for the entire year 2026 is about $40.73 trillion, or 125.8% of GDP. It slightly exceeds the $40.047 trillion actually recorded by the US Treasury on August 18, as these are different indicators: the first is the IMF estimate for 2026 according to the general government methodology, the second is the daily indicator of the US federal debt.
The last full-fledged global base that allows such a comparison for almost all countries remains the WEO April 2026. The July update of the WEO is not a new full country's fiscal base.
The USA and China concentrate more than half of the world public debt
According to the calculations of the Experts Club, among 180 countries for which comparative data for 2026 are available, the total public debt is about $119.4 trillion.
The United States provides about a third of this amount.
China is in second place — about $22.29 trillion, or 106.9% of GDP. Together, the USA and China concentrate about 53% of the debt of all countries included in the calculation.
Japan occupies the third place - about $8.95 trillion. At the same time, it is Japan among the largest economies that has one of the highest indicators of debt in relation to the economy — more than 204% of GDP.
The top ten also includes Great Britain, France, Italy, Germany, India, Canada and Brazil.
The ten largest debtors account for about 81% of the total amount of public debt, calculated for countries with available data.
Rating of the countries of the world by absolute public debt debt in 2026
Place | Country | National Debt | Debt to GDP |
|---|
1 | USA | $40.73 trillion | 125.8% |
2 | China | $22.29 trillion | 106.9% |
3 | Japan | $8.95 trillion | 204.4% |
4 | Great Britain | $4.42 trillion | 103.6% |
5 | France | $4.26 trillion | 118.4% |
6 | Italy | $3.79 trillion | 138.4% |
7 | Germany | $3.52 trillion | 64.6% |
8 | India | $3.46 trillion | 83.4% |
colspan="1" rowspan="1" style="text-align: right;">110.7%
10 | Brazil | $2.54 trillion | 96.5% |
11 | Spain | $2.05 trillion | 98.2% |
12 | Mexico | $1.33 trillion | 62.7% |
13 | Singapore | $1.13 trillion | 171.9% |
14 | Australia | $1.08 trillion | 50.6% |
15 | South Korea | $1.05 trillion | 54.4% |
16 | Belgium | $848.2 billion | 109.2% |
17 | Poland | $745.5 billion | 65.7% |
18 | The Netherlands | $639.9 billion | 44.1% |
19 | Indonesia | $638.7 billion | 41.5% |
20 | Austria | $511.8 billion | 82.0% |
21 | Russia | $507.2 billion | 19.1% |
22 | Israel | $502.7 billion | 69.8% |
23 | Argentina | $484.7 billion | 70.4% |
24 | Saudi Arabia | $445.3 billion | 32.1% |
25 | Switzerland | $441.6 billion | 38.5% |
26 | Greece | $421.1 billion | 136.9% |
27 | Turkey | $418.9 billion | 25.5% | colspan="1" rowspan="1" style="text-align: right;">66.8%
29 | South Africa | $378.8 billion | 78.9% |
30 | Egypt | $373.8 billion | 87.0% |
31 | Malaysia | $358.8 billion | 69.5% |
32 | Colombia | $328.4 billion | 60.9% |
33 | Portugal | $325.7 billion | 85.6% |
34 | Finland | $314.4 billion | 93.1% |
35 | Philippines | $308.6 billion | 60.2% |
36 | Romania | $297.8 billion | 61.9% |
37 | Sweden | $279.3 billion | 36.7% |
38 | Ukraine | $276.2 billion | 122.6% |
39 | Taiwan* | $269.2 billion | 27.6% |
40 | Norway | $257.3 billion | 42.9% |
41 | Ireland | $246.5 billion | 31.6% |
42 | Bangladesh | $213.5 billion | 41.8% |
43 | Hungary | $211.1 billion | 77.9% |
44 | Czech Republic | $200.8 billion | 46.4% |
45 | UAE | $194.9 billion | 31.4% |
46 | Algeria | $187.6 billion | 59.2% |
colspan="1" rowspan="1" style="text-align: right;">42.5%
48 | Iraq | $163.4 billion | 61.7% |
49 | New Zealand | $158.0 billion | 56.7% |
50 | Vietnam | $157.1 billion | 29.8% |
51 | Denmark | $137.9 billion | 27.4% |
52 | Morocco | $127.8 billion | 65.8% |
53 | Nigeria | $122.0 billion | 32.3% |
54 | Peru | $114.2 billion | 30.0% |
55 | Iran | $111.9 billion | 37.3% |
56 | Slovakia | $106.3 billion | 63.0% |
57 | Kenya | $105.4 billion | 71.6% |
58 | Qatar | $94.20 billion | 43.3% |
59 | Kazakhstan | $89.87 billion | 24.9% |
60 | Bolivia | $82.92 billion | 102.7% |
61 | Dominican Republic | $79.34 billion | 58.3% |
62 | Angola | $78.58 billion | 51.6% |
63 | Sudan | $75.56 billion | 169.1% |
64 | Bahrain | $74.43 billion | 152.4% |
65 | Costa Rica | $67.17 billion | 61.1% | colspan="1" rowspan="1" style="text-align: right;">56.5%
67 | Uruguay | $64.18 billion | 66.8% |
68 | Ghana | $62.71 billion | 53.0% |
69 | Côte d'Ivoire | $61.74 billion | 55.1% |
70 | Slovenia | $56.51 billion | 65.2% |
71 | Panama | $54.87 billion | 57.7% |
72 | Senegal | $53.54 billion | 132.3% |
73 | Jordan | $53.08 billion | 81.8% |
74 | Tunisia | $51.56 billion | 84.9% |
75 | Uzbekistan | $49.88 billion | 27.5% |
76 | Ethiopia | $49.15 billion | 40.4% |
77 | Lithuania | $47.79 billion | 45.1% |
78 | Serbia | $47.77 billion | 42.6% |
79 | Tanzania | $46.22 billion | 48.7% |
80 | Myanmar | $43.51 billion | 51.9% |
81 | Bulgaria | $41.79 billion | 28.2% |
82 | Uganda | $40.33 billion | 55.0% |
83 | Kuwait | $38.55 billion | 22.3% |
84 | Oman | $38.30 billion | 32.7% | colspan="1" rowspan="1" style="text-align: right;">27.6%
86 | Belarus | $33.75 billion | 33.1% |
87 | El Salvador | $33.68 billion | 84.5% |
88 | Luxembourg | $30.96 billion | 28.0% |
89 | DRC | $30.37 billion | 24.6% |
90 | Cameroon | $25.60 billion | 39.3% |
91 | Latvia | $25.47 billion | 47.4% |
92 | Mozambique | $24.69 billion | 106.1% |
93 | Zimbabwe | $24.01 billion | 42.3% |
94 | Iceland | $23.47 billion | 53.6% |
95 | Cyprus | $22.98 billion | 50.9% |
96 | Paraguay | $22.86 billion | 37.8% |
97 | Nepal | $22.74 billion | 49.6% |
98 | Trinidad and Tobago | $22.58 billion | 84.1% |
99 | Gabon | $20.11 billion | 86.1% |
100 | Honduras | $18.18 billion | 43.8% |
101 | Albania | $17.18 billion | 51.5% |
102 | Papua New Guinea | $16.94 billion | 49.2% |
103 | Armenia | $16.13 billion | 50.6% | colspan="1" rowspan="1" style="text-align: right;">57.2%
105 | Burkina Faso | $15.88 billion | 48.8% |
106 | Azerbaijan | $15.71 billion | 20.0% |
107 | Republic of Congo | $15.54 billion | 91.3% |
108 | Jamaica | $15.15 billion | 65.8% |
109 | Georgia | $15.00 billion | 35.1% |
110 | Mauritius | $14.80 billion | 86.5% |
111 | Malta | $14.53 billion | 47.3% |
112 | Estonia | $14.37 billion | 27.8% |
113 | Cambodia | $14.19 billion | 27.1% |
114 | Laos | $14.15 billion | 74.6% |
115 | Small | $13.81 billion | 40.8% |
116 | Malawi | $13.52 billion | 74.5% |
117 | Guinea | $13.38 billion | 44.7% |
118 | Mongolia | $12.42 billion | 43.7% |
119 | Bahamas Islands | $12.25 billion | 71.9% |
120 | Namibia | $12.20 billion | 70.5% |
121 | Rwanda | $11.57 billion | 66.8% |
122 | North Macedonia | $11.47 billion | 53.1% |
123 | Bosnia and Herzegovina | $11.31 billion | 30.8% |
124 | Niger | $11.28 billion | 45.5% |
125 | Maldives | $10.52 billion | 129.4% |
126 | Madagascar | $10.44 billion | 49.3% |
127 | Botswana | $10.31 billion | 47.0% |
128 | Guyana | $9.908 billion | 29.2% |
129 | Kyrgyzstan | $8.825 billion | 37.4% |
130 | Togo | $8.692 billion | 64.7% |
131 | Moldova | $8,612 billion | 39.3% |
132 | Nicaragua | $8.042 billion | 33.2% |
133 | Chad | $7.675 billion | 29.9% |
134 | Barbados | $7,594 billion | 89.5% |
135 | Montenegro | $6.386 billion | 62.4% |
136 | Equatorial Guinea | $5.371 billion | 39.1% |
137 | Mauritania | $5.321 billion | 37.1% |
138 | Fiji | $5,242 billion | 82.5% |
139 | Suriname | $5.145 billion | 87.1% |
140 | Bhutan | $4.638 billion | 120.3% |
141 | Tajikistan | $4.467 billion | 21.9% | colspan="1" rowspan="1" style="text-align: right;">10.7%
143 | Sierra Leone | $3.665 billion | 44.3% |
144 | South Sudan | $3.478 billion | 57.3% |
145 | Cape Verde | $3.307 billion | 95.9% |
146 | Turkmenistan | $3.063 billion | 3.7% |
147 | Liberia | $3.035 billion | 53.8% |
148 | Burundi | $3.010 billion | 37.0% |
149 | Esvatini | $2.896 billion | 50.0% |
150 | Kosovo* | $2.632 billion | 18.7% |
151 | Central African Republic | $2.234 billion | 64.0% |
152 | Guinea-Bissau | $2.197 billion | 73.6% |
153 | Belize | $2.180 billion | 63.2% |
154 | Saint Lucia | $2.142 billion | 77.5% |
155 | Gambia | $1,906 billion | 68.3% |
156 | San Marino | $1.870 billion | 77.3% |
157 | Antigua and Barbuda | $1.586 billion | 66.5% |
158 | Saint Vincent and the Grenadines | $1.484 billion | 120.1% |
159 | Lesotho | $1.457 billion | 49.0% |
160 | Djibouti | $1.399 billion | 29.6% |
161 | Andorra | $1.368 billion | 28.0% |
162 | Seychelles | $1.237 billion | 55.0% |
163 | Grenada | $1.023 billion | 69.0% |
164 | Dominica | $777.5 million | 98.3% |
165 | St. Kitts and Nevis | $731.7 million | 64.0% |
166 | Vanuatu | $603.6 million | 43.2% |
167 | Comoros Islands | $587.4 million | 32.4% |
168 | São Tome and Principe | $585.6 million | 50.4% |
169 | Solomon Islands | $548.7 million | colspan="1" rowspan="1" style="text-align: right;">$324.2 million
14.9% |
171 | Brunei | $249.9 million | 1.5% |
172 | Tonga | $246.4 million | 34.4% |
173 | Samoa | $235.9 mln. colspan="1" rowspan="1" style="text-align: right;"> $213.7 million | 56.7% |
175 | Marshall Islands | $57.3 million | 16.7% |
176 | Liechtenstein | $49.5 million | 0.5% |
177 | Micronesia | $39.00 mln. colspan="1" rowspan="1" style="text-align: right;"> $31.1 million | 7.7% |
179 | colspan="1" rowspan="1" style="text-align: right;">180
Tuvalu | $2.1 million | 3.2% |
*Taiwan and Kosovo are shown separately according to the statistical coverage of the WEO.
There is no comparative assessment for 2026 for 17 countries
Old figures for 2024 or 2025 were deliberately not substituted into the ranking, as this would violate the methodology.
At the moment compilation of the IMF study does not simultaneously provide GDP in dollars and estimates of general government gross debt for 2026 for Afghanistan, Ecuador, Eritrea, Lebanon, Libya, Pakistan, Somalia, Syria, Sri Lanka, Venezuela, Palestine, Yemen and Zambia.
In addition, the full WEO database does not contain comparable figures for Cuba, North Korea, Monaco and Vatican.
Therefore, all these states are included in the global coverage of the study, but do not receive an artificial place in the ranking until the comparative statistics appear.
Ukraine is in 38th place
Ukraine, according to the comparative assessment of the IMF, has a public debt of about $276 billion, or 122.6% of the projected GDP in 2026, which corresponds to the 38th place in the world in terms of absolute volume.
It is important to understand that this figure is higher than the often published indicator of direct state and state-guaranteed debt of Ukraine. The reason is the broader methodology of the general government sector and the IMF's forecast assessment for the entire year 2026.
In terms of the ratio of debt to the size of the economy, Ukraine is much higher than most of the countries of Central and Eastern Europe.
For comparison, Poland has about $746 billion in debt, but its ratio to GDP is about 65.7%; Romania — $298 billion and 61.9%; Hungary — $211 billion and 77.9%; Serbia - about $47.8 billion and 42.6%.
Russia - 21st in terms of absolute debt
Russia, with an estimated gross public debt of about $507 billion, or 19.1% of GDP, ranks 21st.
This is a low level of public debt relative to GDP among the world's economies. However, a low debt burden in itself is not a complete assessment of the state of public finances. It does not take into account the cost of borrowing, access to international capital markets, sanctions restrictions, liquidity of sovereign funds and other factors.
Absolute debt and debt burden - different ratings
The rating by the amount of debt cannot be interpreted as a rating of financial vulnerability.
Germany has more than $3.5 trillion in public debt, but its ratio to GDP is about 65%. Japan has nearly $9 trillion in debt and more than 204% of GDP.
Singapore, with a gross public debt of more than $1.1 trillion, has at the same time very large public financial assets, so the gross debt does not reflect its net financial position.
Therefore, the Experts Club recommends evaluating public debt by at least three parameters: the absolute amount of debt, debt to GDP and its value service.
In terms of absolute amount, the USA and China dominate today. In relation to GDP, the leaders are completely different, and in terms of cost of service, the structure of the rating changes even more.
Main source: International Monetary Fund, World Economic Outlook Database, April 2026. Experts Club calculations are based on GDP, current prices, billions of U.S. dollars and General government gross debt, percent of GDP. For actual U.S. current debt, daily U.S. data were used. Department of the Treasury as of August 18, 2026.